Martha's
Vineyard Real Estate Market Trends
Martha’s
Vineyard Real Estate Sales History Current
Month
February 2022 |
Homes
Sold:
|
19 |
Condos Sold:
|
0 |
Multi-Family
Sold:
|
3 |
Commercial
Sold:
|
5 |
Land Sold:
|
6 |
Total Properties
Sold:
|
33 |
Total Value
of Sales:
|
$60,641,308 |
Median Selling
Price:
|
$1,000,000 |
Percent of
Asking Price to Selling Price:
|
97.05% |
Percent of
Assessed Value to Selling Price:
|
163.80% |
Martha’s
Vineyard Real Estate Sales History Same Month
Prior Year
February 2021 |
Homes
Sold:
|
38 |
Condos Sold:
|
0 |
Multi-Family
Sold:
|
0 |
Commercial
Sold:
|
2 |
Land Sold:
|
5 |
Total
Properties Sold:
|
45 |
Percent Change
in Number Properties Sold:
|
(26.67%) |
| Total Value
of Sales: |
$79,184,600 |
| Percent Change
in Value of Sales: |
(23.41%) |
| Median Selling
Price: |
$960,000 |
| Percent Change
in Median Selling Price: |
4.16% |
Percent of
Asking Price to Selling Price:
|
96.24% |
Percent of
Assessed Value to Selling Price:
|
156.35% |
Martha’s
Vineyard Real Estate Sales History Prior
Month
January 2022 |
Homes
Sold:
|
30 |
Condos Sold:
|
1 |
Multi-Family
Sold:
|
1 |
Commercial
Sold:
|
2 |
Land Sold:
|
7 |
Total
Properties Sold:
|
41 |
Percent Change
in Number Properties Sold:
|
(19.51%) |
| Total Value
of Sales: |
$68,930,000 |
| Percent Change
in Value of Sales: |
(12.02%) |
| Median Selling
Price: |
$1,045,000 |
| Percent Change
in Median Selling Price: |
(4.30%) |
Martha’s
Vineyard Real Estate Sales History
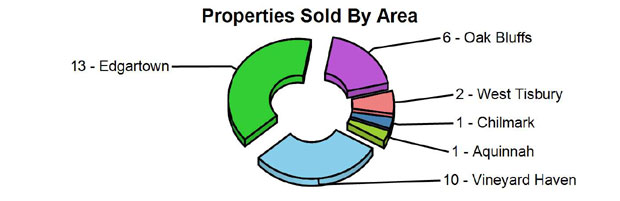
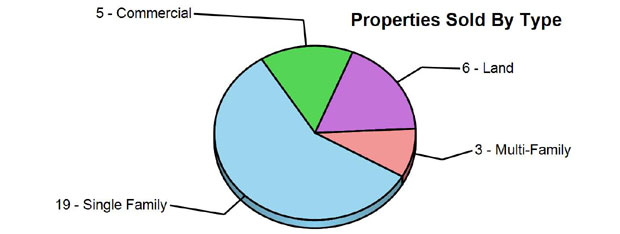
Year-To-Date Sales Summary for 2022 |
Homes
Sold (Including Condos & Multi-Family):
|
54 |
Land Sold:
|
13 |
Commercial
Sold:
|
7 |
Total Properties
Sold:
|
74 |
Total Value
of Sales
|
$129,571,000 |
Median Selling
Price:
|
$1,025,000 |
Percent of
Asking Price to Selling Price:
|
97.75% |
Percent of
Assessed Value to Selling Price:
|
173.60% |
Martha’s
Vineyard Real Estate Sales History
Year-To-Date Sales Summary for Same Time 2021 |
Homes
Sold (Including Condos & Multi-Family):
|
80 |
Land Sold:
|
18 |
Commercial
Sold:
|
3 |
Total Properties
Sold:
|
101 |
Percent Change
in Number of Properties Sold:
|
(26.73%) |
Total Value
of Sales
|
$152,542,000 |
Percent Change
in Value of Sales:
|
(15.05%) |
Median Selling
Price:
|
$960,000 |
Percent Change
in Median Selling Price:
|
6.77% |
|
|
|